
Know What Your Outreach Is Actually Producing.
Track sending activity, replies, bounce rates, meetings and campaign performance from one clear analytics workspace.
- Per-campaign performance
- Replies and meetings tracked
- Today separated from lifetime
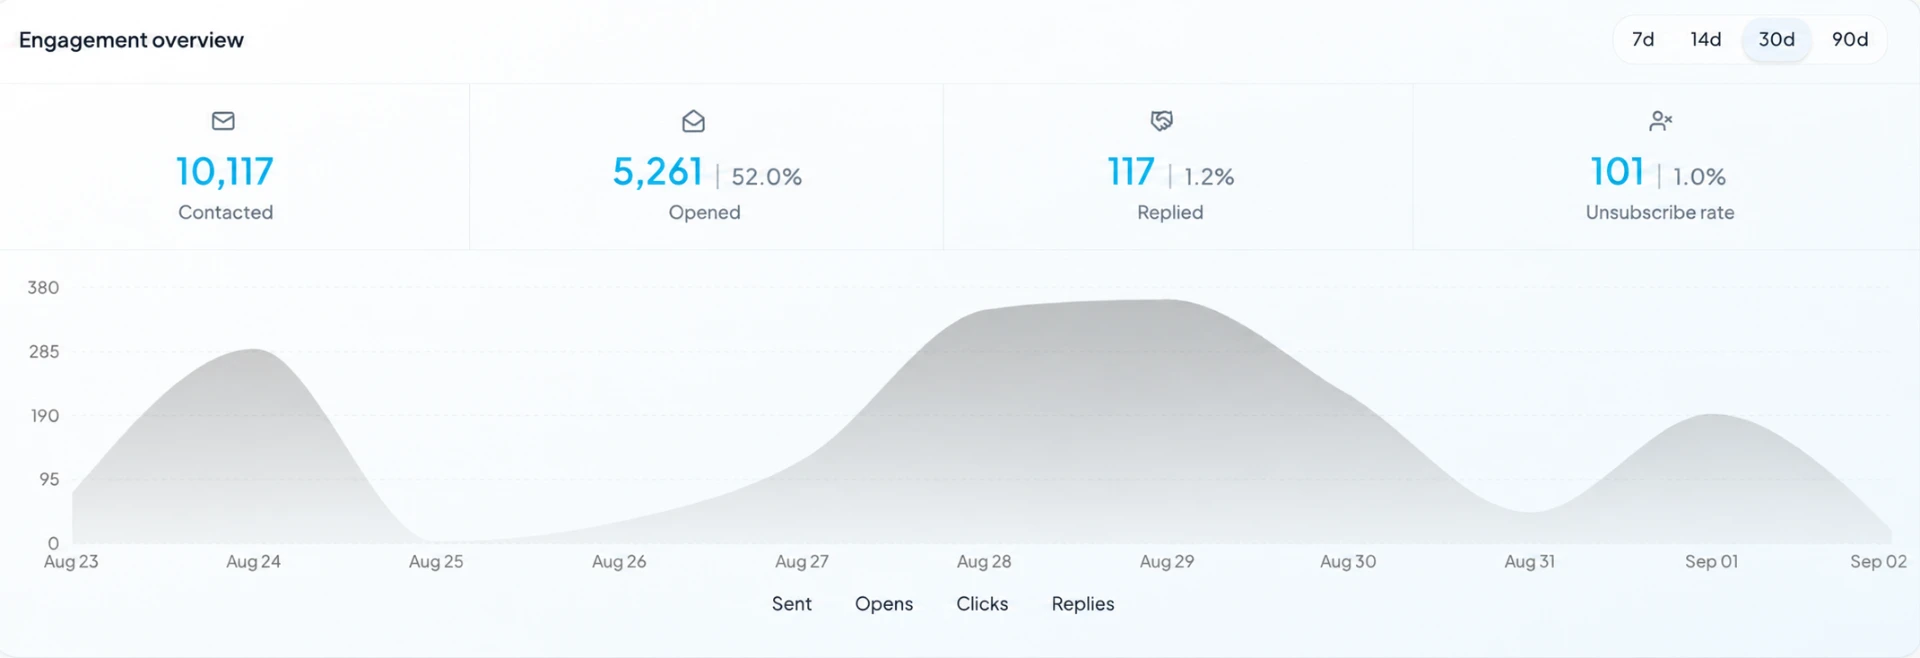
Your outbound performance at a glance
Emails sent, reply rate, bounce rate, positive replies and meetings booked — filtered by date range, campaign and workspace.
Sending more emails doesn't tell you what is working
The numbers that matter are per campaign, not per month.
Volume is not performance
Five thousand sends tells you nothing about which campaign actually earned replies.
You can't see what to fix
Without per-campaign numbers, an underperforming sequence keeps running unnoticed.
No sense of direction
Is this month better than last? Is bounce rate creeping up? Guessing is not a strategy.
See which campaigns are working
Sent, delivered, replies, reply rate, positive replies, meetings and bounce rate for every campaign, sortable and filterable.
| Campaign | Sent | Delivered | Replies | Reply rate | Positive | Meetings | Bounce rate |
|---|---|---|---|---|---|---|---|
| Q3 Ops Directors | 1,480 | 1,462 | 120 | 8.1% | 41 | 11 | 1.2% |
| Founders — SaaS | 1,120 | 1,101 | 67 | 6.0% | 22 | 6 | 1.7% |
| Reactivation | 980 | 969 | 36 | 3.7% | 9 | 3 | 1.1% |
| Agency partners | 760 | 742 | 18 | 2.4% | 5 | 2 | 2.4% |
| Ops newsletter list | 480 | 474 | 12 | 2.5% | 3 | 2 | 1.3% |
Follow the journey from lead to meeting
Each stage narrows the last — and shows you where the drop-off actually happens.
Contacts loaded into your campaigns.
Messages the engine actually dispatched.
Accepted by the receiving provider.
Human responses matched back to a send.
Responses classified as interested.
Logged from CRM stage changes on the lead.
Measure conversations, not just volume
Measure conversations, not just volume
A large sending volume is only useful if it creates conversations and opportunities. Replies, reply rate, positive replies and meetings are tracked together.
- Replies matched back to the send that produced them
- Positive replies counted separately from all responses
- Meetings logged from CRM stage changes on the lead
See how your outreach changes over time
Sends, reply rate, bounce rate and meetings on one chart, over 7, 30 or 90 days.
- Preset ranges plus custom start and end dates
- Filter the trend down to a single campaign
- Clear empty state when there is not enough activity yet
Empty state: when a workspace has not sent enough yet, the chart says so instead of drawing a line — "Not enough campaign activity to show a trend yet."
Compare campaigns side by side
Put two campaigns next to each other on the metrics that decide whether a sequence is worth keeping.
- Sent, reply rate, positive replies, meetings and bounce rate
- Same date range applied to both sides
- Placeholder values in the interface, your data in the product
- Sent1,4801,120
- Reply rate8.1%6.0%
- Positive replies4122
- Meetings116
- Bounce rate1.2%1.7%
Spot sending problems early
Delivery, bounces and failed sends are three different things — and mixing them hides real problems.
The receiving provider accepted the message.
The provider rejected the address — bad, blocked or nonexistent.
The send never left — an internal or provider error, not a bounce.
Separate today's activity from lifetime results
Today respects the campaign's timezone. Lifetime covers everything since the campaign was created.
- Emails sent
- 412
- Replies
- 26
- Reply rate
- 6.3%
- Bounces
- 4
- Meetings
- 2
Resets at midnight in the campaign's own timezone, not the server's.
- Total sent
- 48,930
- Total replies
- 3,104
- Overall reply rate
- 6.3%
- Total bounces
- 561
- Total meetings
- 218
Every recorded event, with no rolling window applied.
Turn numbers into better decisions
Interface examples. Real signals are generated only from data your workspace has produced.
Reply rate is higher than your previous period.
Bounce rate increased on this campaign.
This campaign is generating replies but fewer positive responses.
One campaign is generating more meetings with fewer sends.
Know which numbers belong to your campaign
Campaign performance and mailbox health are two datasets. MunchReach never blends them into one number.
Campaign analytics
How your outreach performed with prospects.
- Sends
- Deliveries
- Replies
- Bounces
- Meetings
Mailbox health & warmup
How your sending accounts themselves are doing.
- Mailbox health
- Warmup activity
- Sending capacity
- Safety state
Who it's for
Sales teams
Several sequences running at once across the team.
See which campaigns generate conversations and meetings.
Agencies
Client outreach split across separate workspaces.
Understand campaign performance per client.
Founders
Outbound is one of several things you are running.
Know whether it is producing real sales activity.
How it works
Launch your campaigns
Sequences start sending on schedule.
Activity is recorded
Sends, deliveries, bounces and replies log automatically.
Review performance
Check the dashboard, trends and comparisons.
Improve what matters
Fix or retire the campaigns that underperform.
Why MunchReach Analytics
See the full picture
Sending, replies, bounces and meetings understood together, not in isolation.
Find what works
Compare campaigns and identify the outreach that is actually performing.
Make better decisions
Use real campaign data to shape the next campaign you launch.
Frequently Asked Questions
Everything you need to know about MunchReach.
Turn your outreach data into better campaigns.
See what is working, understand what is not, and make better decisions with real campaign data.